A theme for creating a simple, clean bivariate map using
geom_sf.
bi_theme(
  base_family = "sans",
  base_size = 24,
  bg_color = "#ffffff",
  font_color = "#000000",
  ...
)
Arguments
- base_family
A character string representing the font family to be used in the map.
- base_size
A number representing the base size used in the map.
- bg_color
A character string containing the hex value for the desired color of the map's background.
- font_color
A character string containing the hex value for the desired color of the map's text.
- ...
Arguments to pass on to
ggplot2'sthemefunction
Examples
# load suggested dependencies
library(ggplot2)
library(sf)
#> Linking to GEOS 3.12.1, GDAL 3.8.4, PROJ 9.4.0; sf_use_s2() is TRUE
# add breaks, 3x3
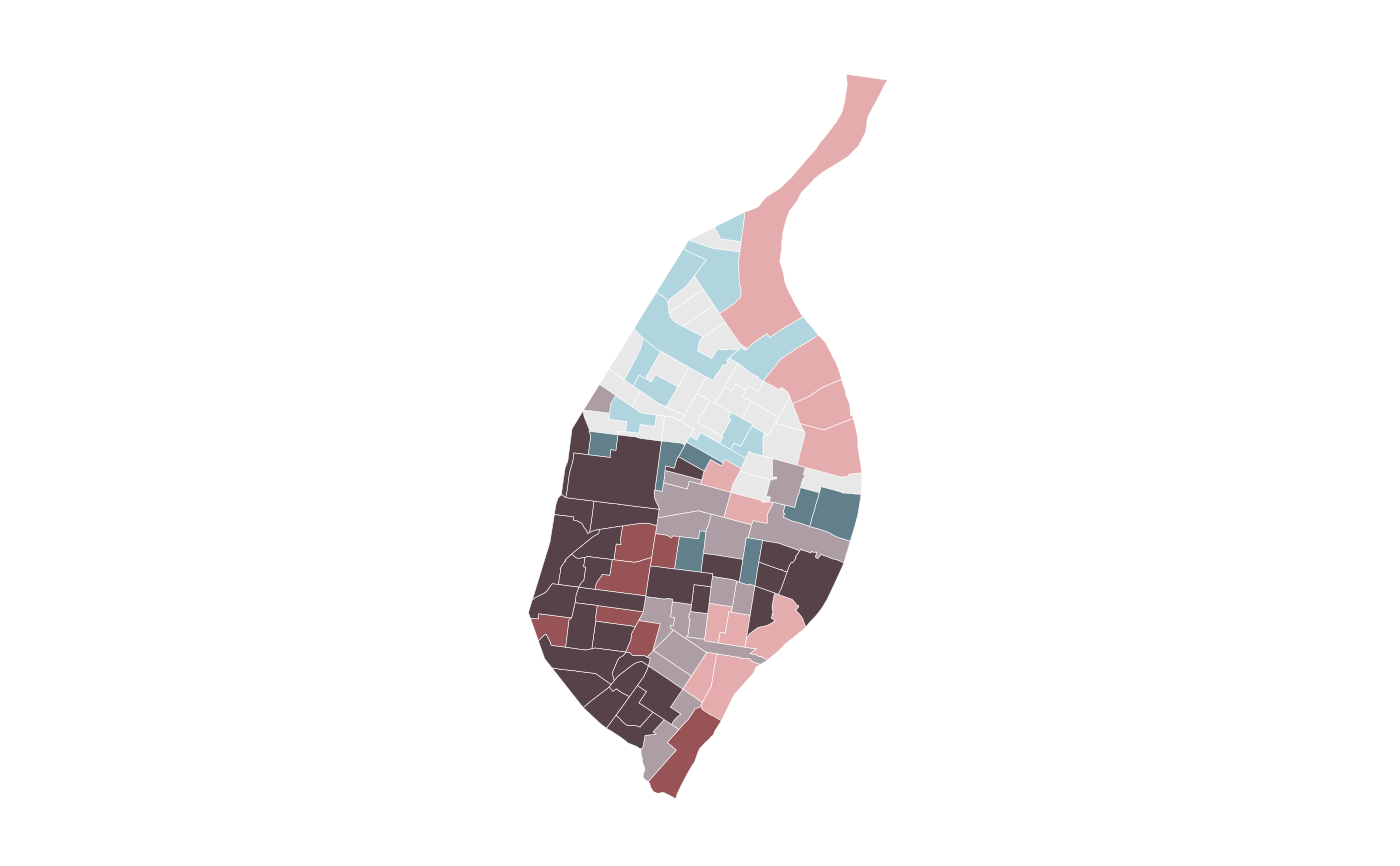
data <- bi_class(stl_race_income, x = pctWhite, y = medInc, style = "quantile", dim = 3)
# create map
ggplot() +
geom_sf(data = data, aes(fill = bi_class), color = "white", size = 0.1, show.legend = FALSE) +
bi_scale_fill(pal = "GrPink", dim = 3) +
bi_theme()