Creates a ggplot object containing a legend that is
specific to bivariate mapping.
bi_legend(pal, dim = 3, xlab, ylab, size = 10, flip_axes = FALSE,
    rotate_pal = FALSE, pad_width = NA, pad_color = "#ffffff",
    breaks = NULL, arrows = TRUE, base_family = "sans")
Arguments
- pal
A palette name or a vector containing a custom palette. See the help file for
bi_palfor complete list of built-in palette names. If you are providing a custom palette, it must follow the formatting described in the 'Advanced Options' vignette.- dim
The dimensions of the palette. To use the built-in palettes, this value must be either
2,3, or4. A value of3, for example, would be used to create a three-by-three bivariate map with a total of 9 classes.If you are using a custom palette, this value may be larger (though these maps can be very hard to interpret). See the 'Advanced Options' vignette for details on the relationship between
dimvalues and palette size.- xlab
Text for desired x axis label on legend
- ylab
Text for desired y axis label on legend
- size
A numeric scalar; size of axis labels
- flip_axes
A logical scalar; if
TRUE, the axes of the palette will be flipped. IfFALSE(default), the palette will be displayed on its original axes. Custom palettes with 'dim' greater than 4 cannot take advantage of flipping axes.- rotate_pal
A logical scalar; if
TRUE, the palette will be rotated 180 degrees. IfFALSE(default), the palette will be displayed in its original orientation. Custom palettes with 'dim' greater than 4 cannot take advantage of palette rotation.- pad_width
An optional numeric scalar; controls the width of padding between tiles in the legend
- pad_color
An optional character scalar; controls the color of padding between tiles in the legend
- breaks
An optional list created by
bi_class_breaks. Depending on the options selected when making the list, labels will placed showing the corresponding range of values for each axis or, ifsplit = TRUE, showing the individual breaks.- arrows
A logical scalar; if
TRUE(default), directional arrows will be added to both the x and y axes of the legend. If you want to suppress these arrows, especially if you are supplying breaks to create a more detailed legend, this parameter can be set ofFALSE.- base_family
A character string; by default, it is set to
"sans", which has been the font used inbiscalesince its initial release. If you are using non-Latin characters, you may need to setbase_family = ""to get your characters to display. Other options include"mono"and"serif". See the Breaks and Legends vignette for details.
Value
A ggplot object with a bivariate legend.
See also
Examples
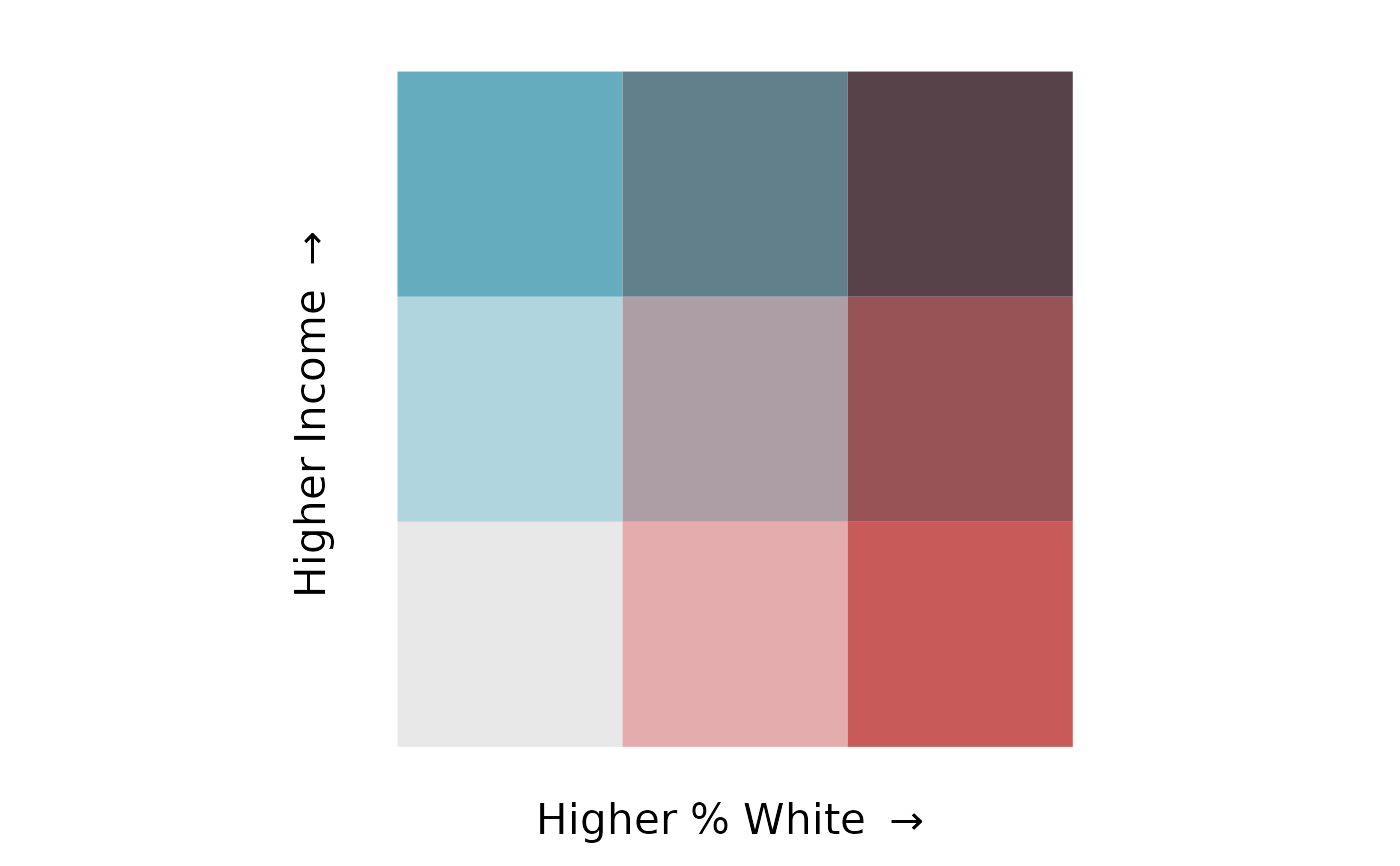
# sample 3x3 legend
legend <- bi_legend(pal = "GrPink",
dim = 3,
xlab = "Higher % White ",
ylab = "Higher Income ",
size = 16)
## print legend
legend
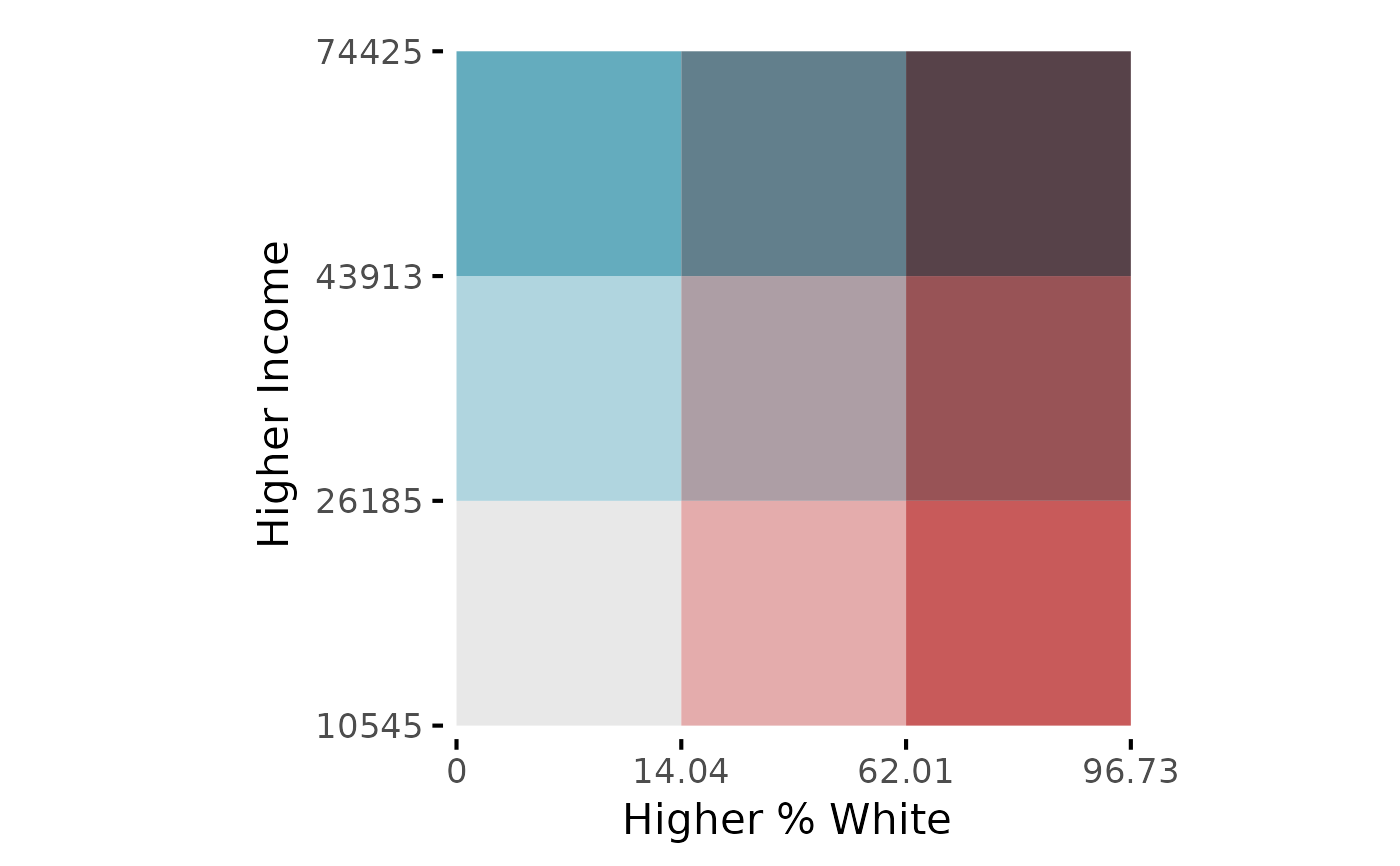
 # sample 3x3 legend with breaks
## create vector of breaks
break_vals <- bi_class_breaks(stl_race_income, style = "quantile",
x = pctWhite, y = medInc, dim = 3, dig_lab = c(x = 4, y = 5),
split = TRUE)
## create legend
legend <- bi_legend(pal = "GrPink",
dim = 3,
xlab = "Higher % White ",
ylab = "Higher Income ",
size = 16,
breaks = break_vals,
arrows = FALSE)
## print legend
legend
# sample 3x3 legend with breaks
## create vector of breaks
break_vals <- bi_class_breaks(stl_race_income, style = "quantile",
x = pctWhite, y = medInc, dim = 3, dig_lab = c(x = 4, y = 5),
split = TRUE)
## create legend
legend <- bi_legend(pal = "GrPink",
dim = 3,
xlab = "Higher % White ",
ylab = "Higher Income ",
size = 16,
breaks = break_vals,
arrows = FALSE)
## print legend
legend