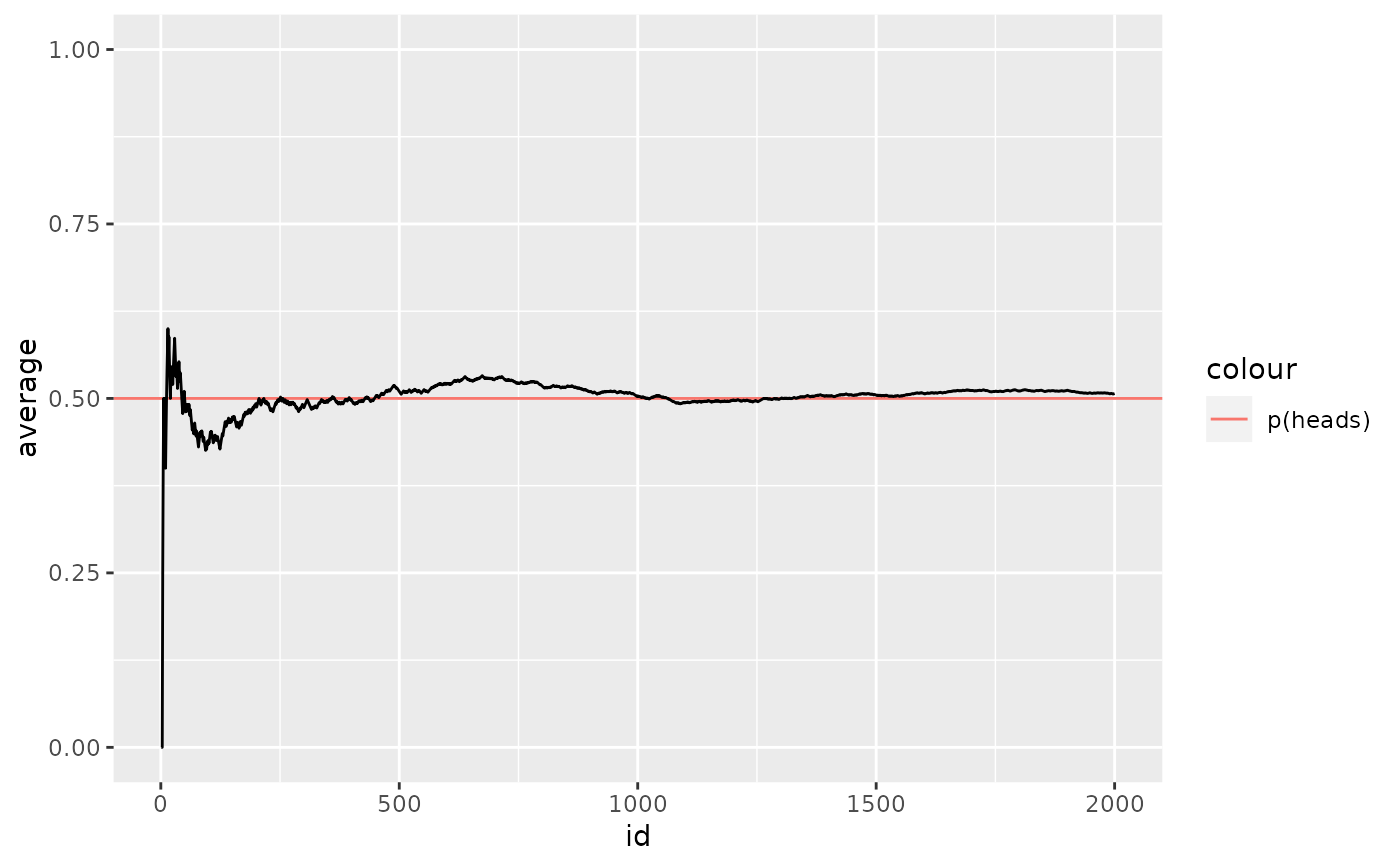
A data set containing 2,000 trials of coin flips from statistician John Edmund Kerrich's 1940s experiments while imprisoned by the Nazis during World War Two.
data(kerrich)Format
A data frame with 1216 rows and 21 variables:
- id
trial
- outcome
outcome of each trial; TRUE = heads, FALSE = tails
- average
cumulative mean of outcomes
Source
https://stats.stackexchange.com/questions/76663/john-kerrich-coin-flip-data/77044#77044
https://books.google.com/books/about/An_experimental_introduction_to_the_theo.html?id=JBTvAAAAMAAJ&hl=en
References
https://en.wikipedia.org/wiki/John_Edmund_Kerrich
Examples
str(kerrich)
#> 'data.frame':	2000 obs. of  3 variables:
#>  $ id     : num  1 2 3 4 5 6 7 8 9 10 ...
#>  $ outcome: logi  FALSE FALSE FALSE TRUE TRUE TRUE ...
#>  $ average: num  0 0 0 0.25 0.4 ...

if (require("ggplot2")) {
    ggplot(data = kerrich) +
        geom_hline(mapping = aes(yintercept = .5, color = "p(heads)")) +
        geom_line(mapping = aes(x = id, y = average)) +
        ylim(0,1)
}
#> Loading required package: ggplot2